Uptrace v2 comes with a new config file and new defaults.
Also updated dependencies to the latest versions.
3.0 KiB
go-redis OpenTelemetry Monitoring with Uptrace
This example demonstrates how to instrument and monitor Redis operations in Go applications using OpenTelemetry and Uptrace, providing comprehensive observability into your Redis performance and operations.
Overview
This integration provides:
- Distributed tracing for Redis operations
- Performance monitoring with latency and throughput metrics
- Error tracking and debugging capabilities
- Visual dashboards for Redis health monitoring
- Production-ready observability stack with Docker
Prerequisites
- Go 1.19+
- Docker and Docker Compose
- Basic understanding of Redis and OpenTelemetry
Quick Start
1. Clone and Navigate
git clone https://github.com/redis/go-redis.git
cd example/otel
2. Start the Monitoring Stack
Launch Redis and Uptrace services:
docker compose up -d
This starts:
- Redis server on
localhost:6379 - Uptrace APM on
http://localhost:14318
3. Verify Services
Check that Uptrace is running properly:
docker compose logs uptrace
Look for successful startup messages without errors.
4. Run the Example
Execute the instrumented Redis client:
go run client.go
You should see output similar to:
trace: http://localhost:14318/traces/ee029d8782242c8ed38b16d961093b35
Click the trace URL to view detailed operation traces in Uptrace.
5. Explore the Dashboard
Open the Uptrace UI at http://localhost:14318 to explore:
- Traces: Individual Redis operation details
- Metrics: Performance statistics and trends
- Logs: Application and system logs
- Service Map: Visual representation of dependencies
Advanced Monitoring Setup
Redis Performance Metrics
For production environments, enable comprehensive Redis monitoring by installing the OpenTelemetry Collector:
The OpenTelemetry Collector acts as a telemetry agent that:
- Pulls performance metrics directly from Redis
- Collects system-level statistics
- Forwards data to Uptrace via OTLP protocol
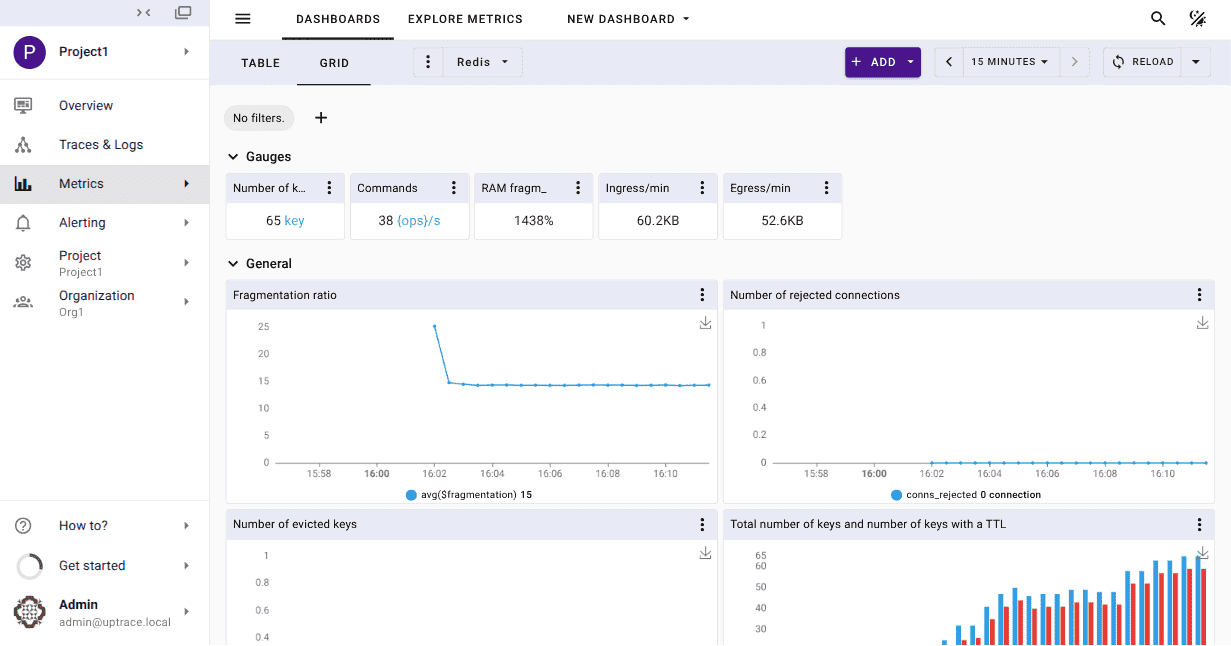
When configured, Uptrace automatically generates a Redis dashboard:
Key Metrics Monitored
- Connection Statistics: Active connections, connection pool utilization
- Command Performance: Operation latency, throughput, error rates
- Memory Usage: Memory consumption, key distribution
- Replication Health: Master-slave sync status and lag
Logs and Debugging
View service logs:
# All services
docker compose logs

# Specific service
docker compose logs redis
docker compose logs uptrace

